
LEGO.com Replacement Part Request Flow
Project Overview
Project TypeWeb app
RoleDesign Lead
Time2023 - 2024
ToolsFigma, ProtoPie
DescriptionThe replacement parts request flow is a self-serve experience for user who have a missing or broken bricks from a LEGO set. After analysing the existing flow, me and my team ran a design sprint. From the sprint, ideas and prototypes were created and tested by users. The product went live and it has made outstanding impacts for both users and the business side.
Project Objective
The main objective of this project is to make the experience/flow simple and enable users to self-serve more rather than contacting customer advisors. It is for both users and business sides. Users can make a quick request whenever they want without waiting to contact customer advisors and the the customer service team can focus on other tasks. The main success metric is the completion rate of the flow.
Context and Analysis
Context
The LEGO.com replacement parts request flow is a self-serve experience that users can use when they want to request a missing or broken bricks in a LEGO set. Because of some complexity in the existing flow, the completion rate of the request was low which means users needed to contact advisors to get their missing or broken bricks.
Legacy Product
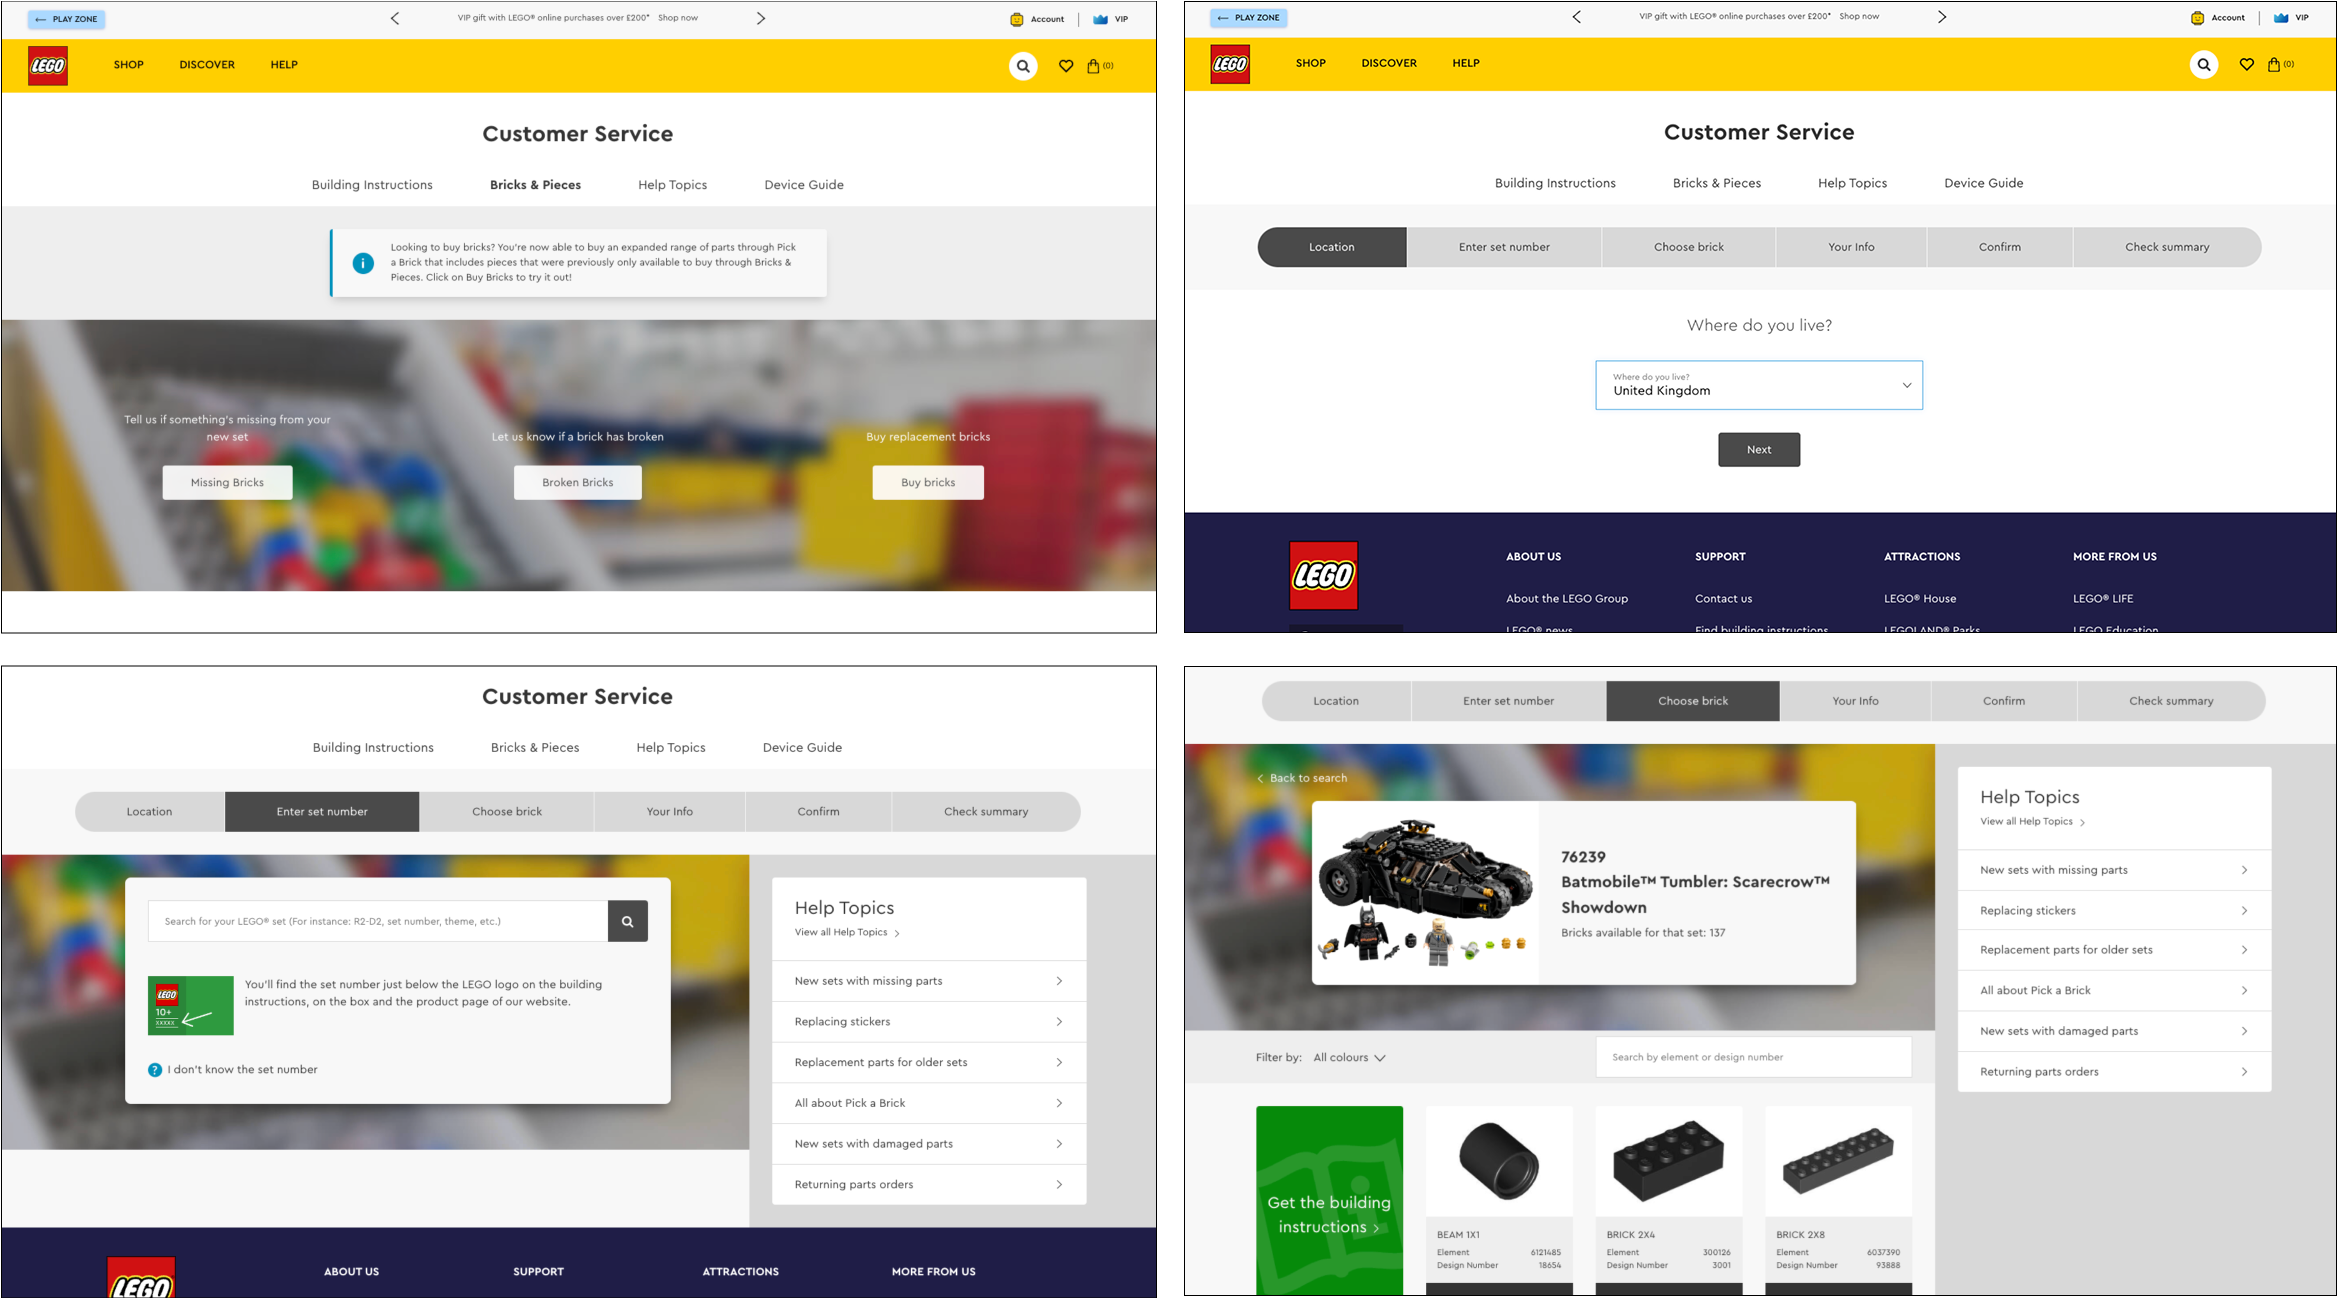
Existing Flow Analysis
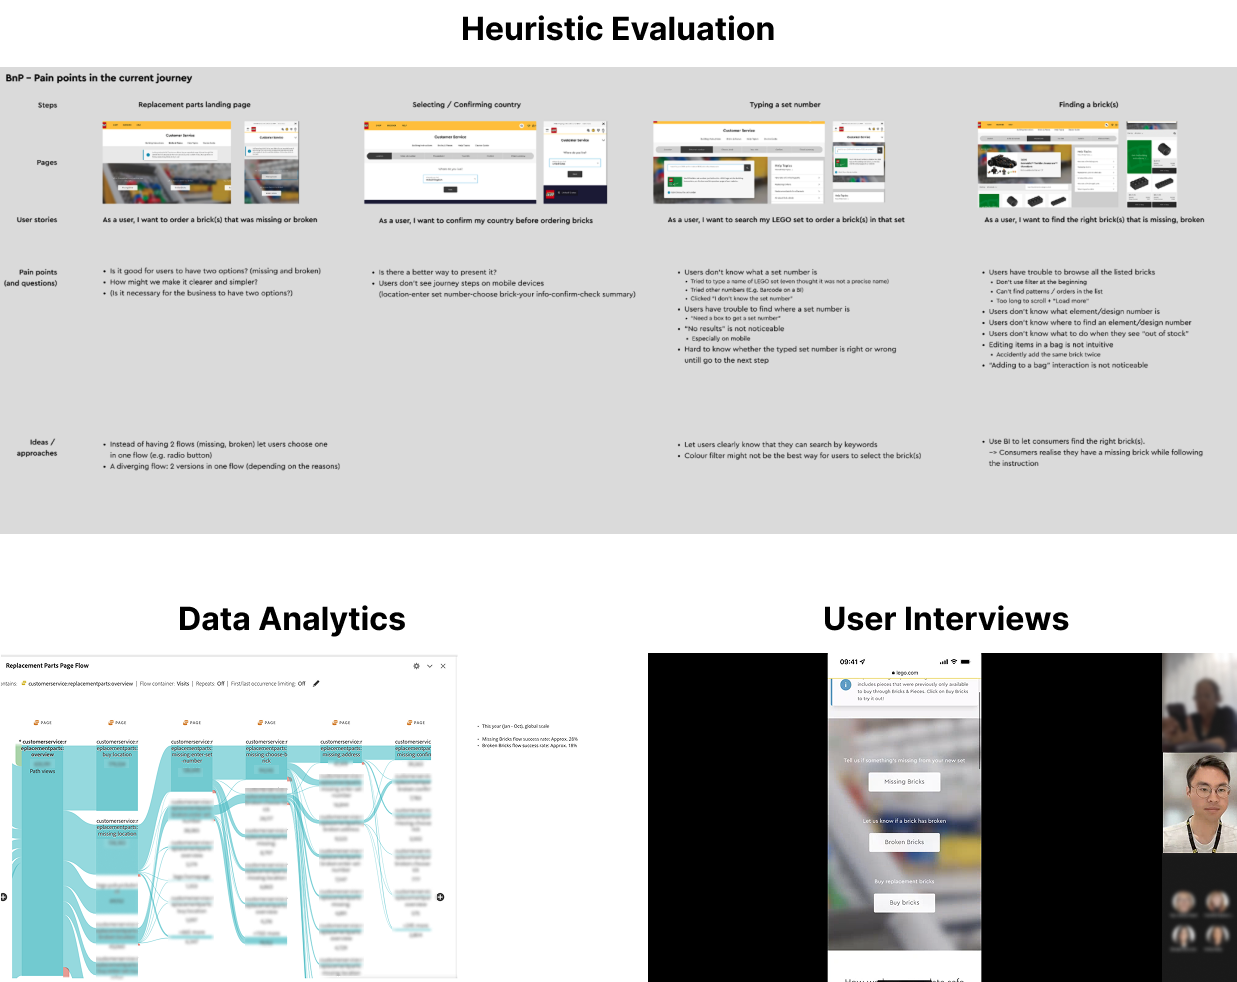
The existing/current flow was analysed with heuristic evaluation, data analytics and user interviews to find opportunities to improve the flow.
Design Sprint
To improve the flow and experience, a design sprint process was planned to build a shared understanding with the team and stakeholders, and to find ideas we want to test for the future improvement.
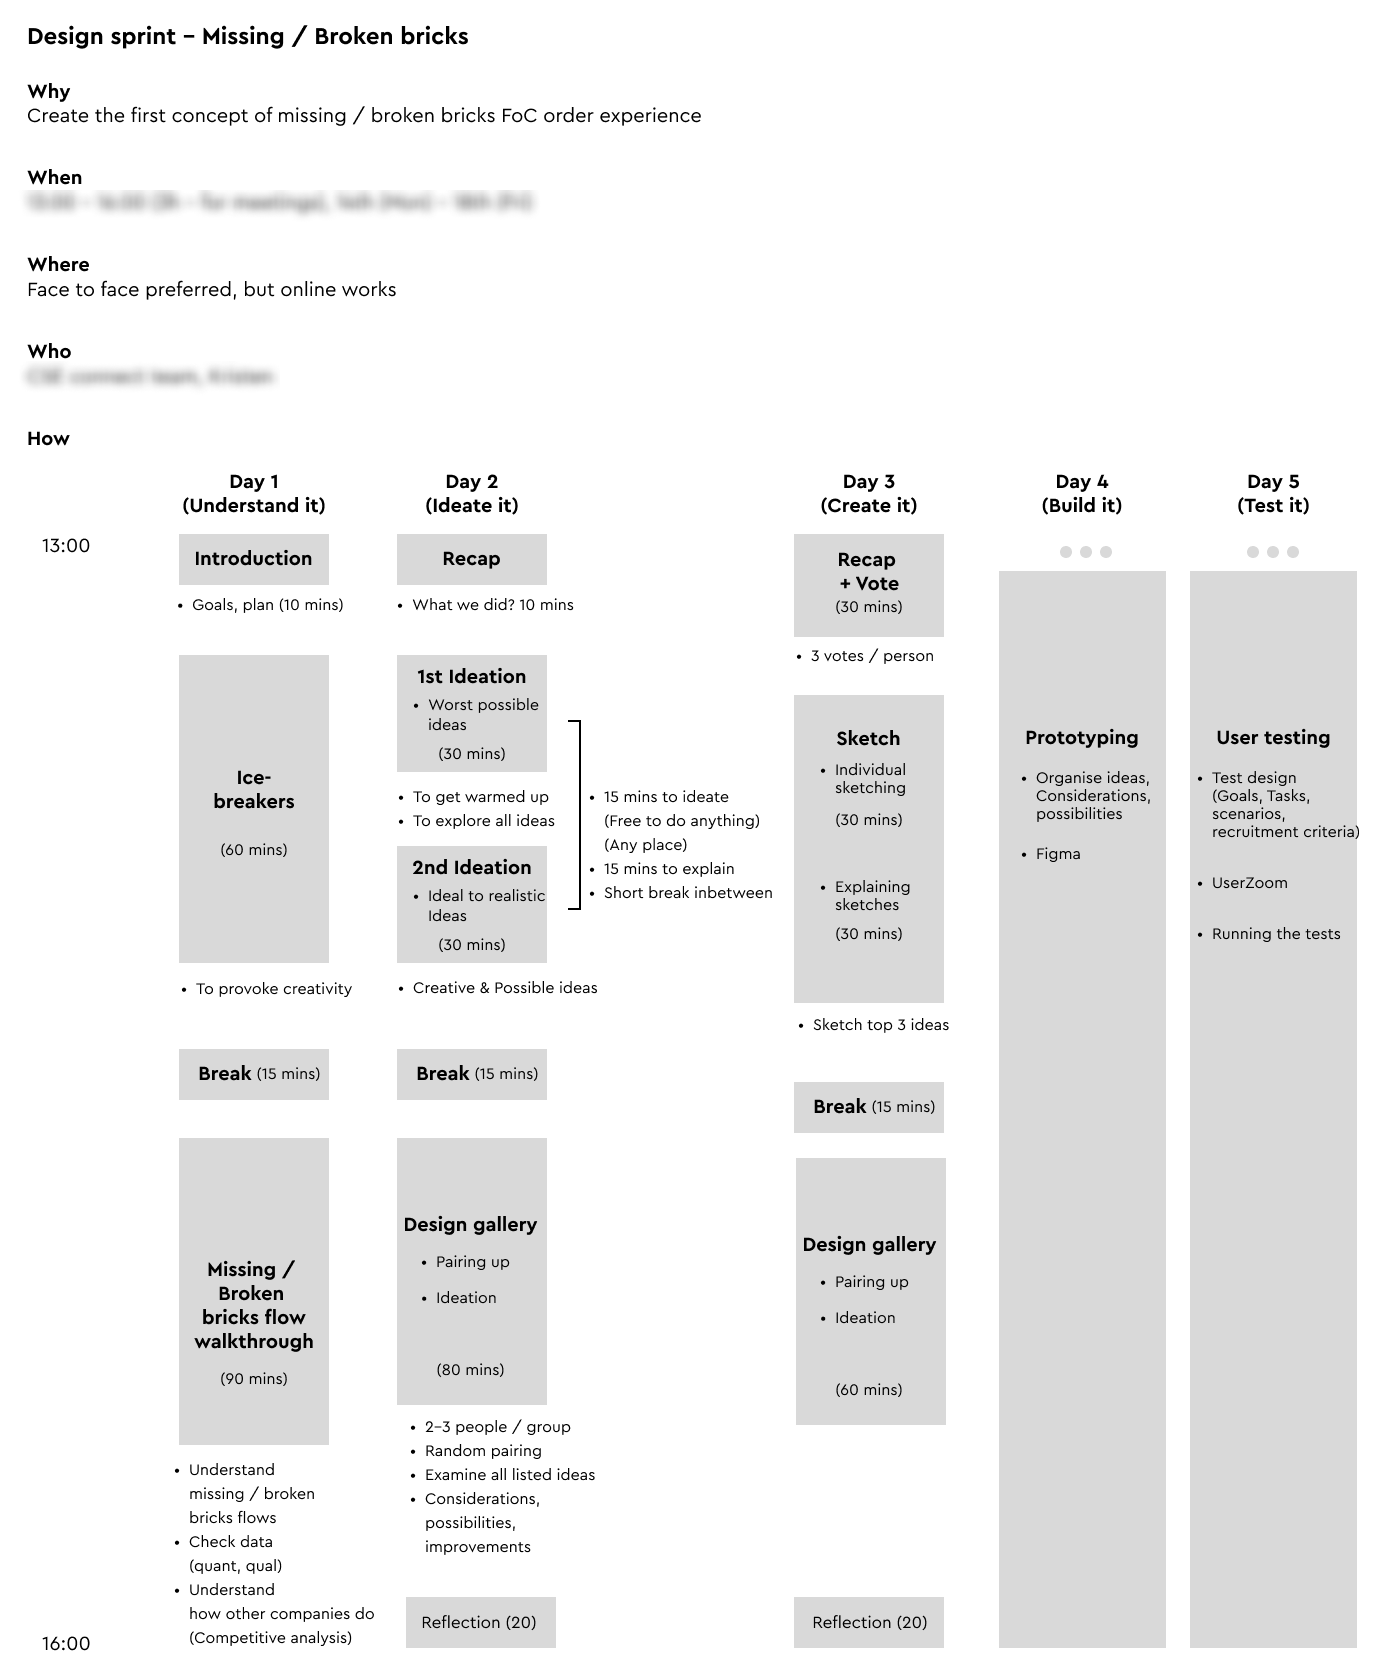
Day 1: Understand it
On Day 1 of the sprint, the existing flow, quantitative data from analytics, qualitative data from user interviews were presented to build a shared understanding with the team members and stakeholders. And we pointed out the main problems we wanted to improve.
- Users struggle to digest guidance how to proceed since the information is text-heavy.
- There are redundant steps and pages to complete the flow (e.g. an extra click to find information, an extra page to proceed).
- (Business point) The flow can be abused easily to order lots of free of charge LEGO bricks and pieces.
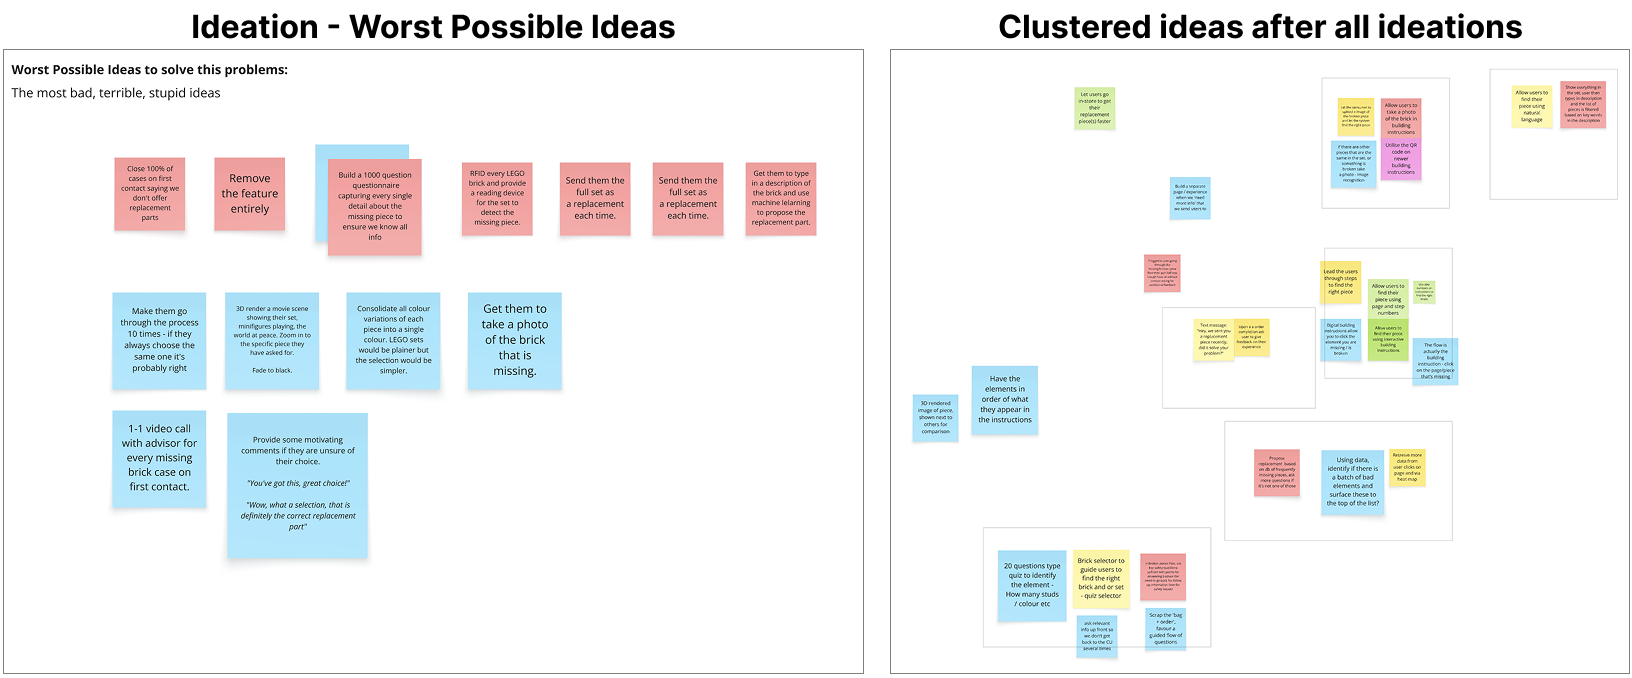
Day 2: Ideate it
On day 2, the team and the stakeholders had some ideation sessions - Worst Possible Ideas and Realistic Ideas - and generated some solutions to improve the flow. Similar ideas were grouped. The team discussed the effect and effort of the groups of ideas.
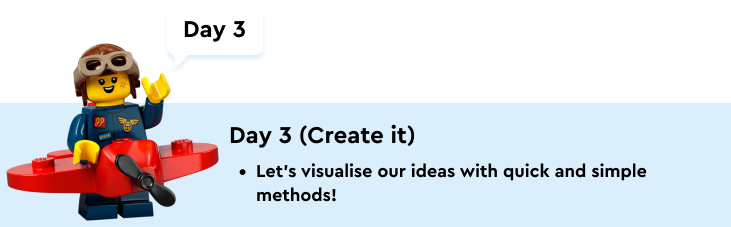
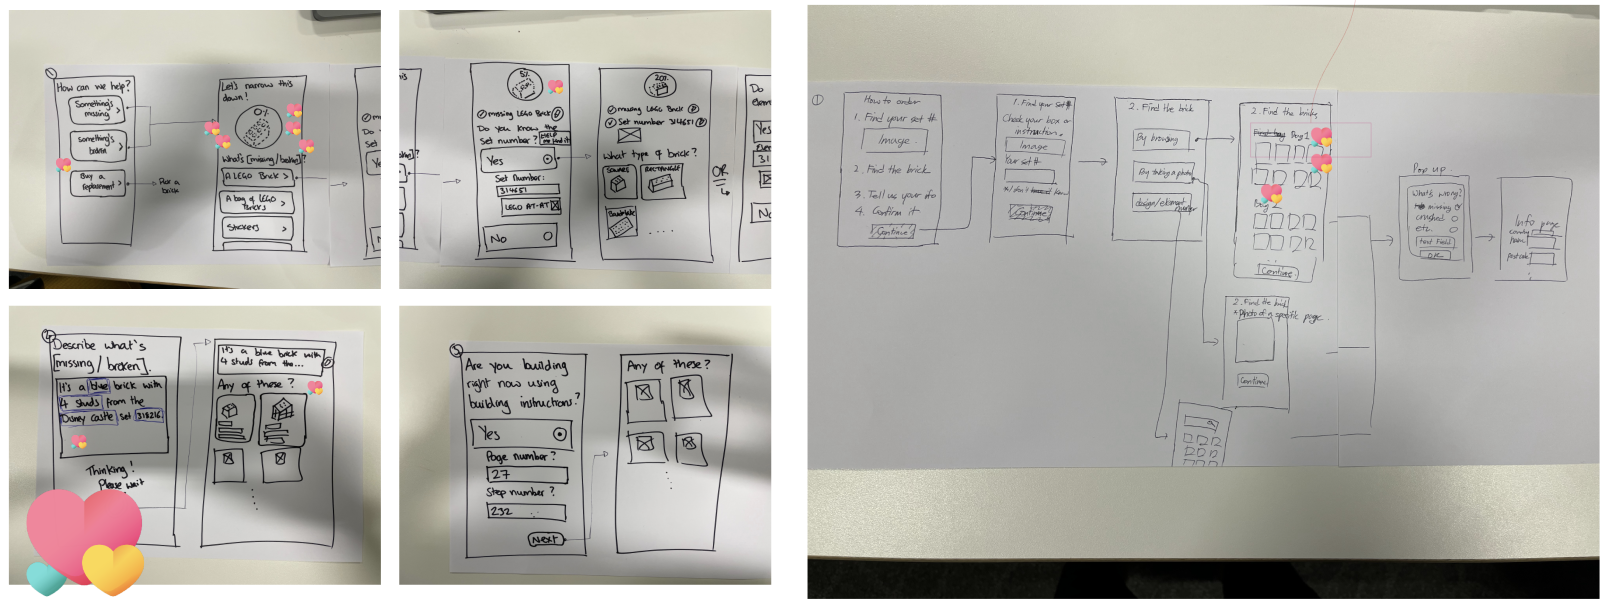
Day 3: Create it
On day 3, everyone sketched and visualised ideas grouped and discussed from the previous day. After explaining each one's sketches, we voted to the favourite sketches.
Day 4: Build it (Prototype it)
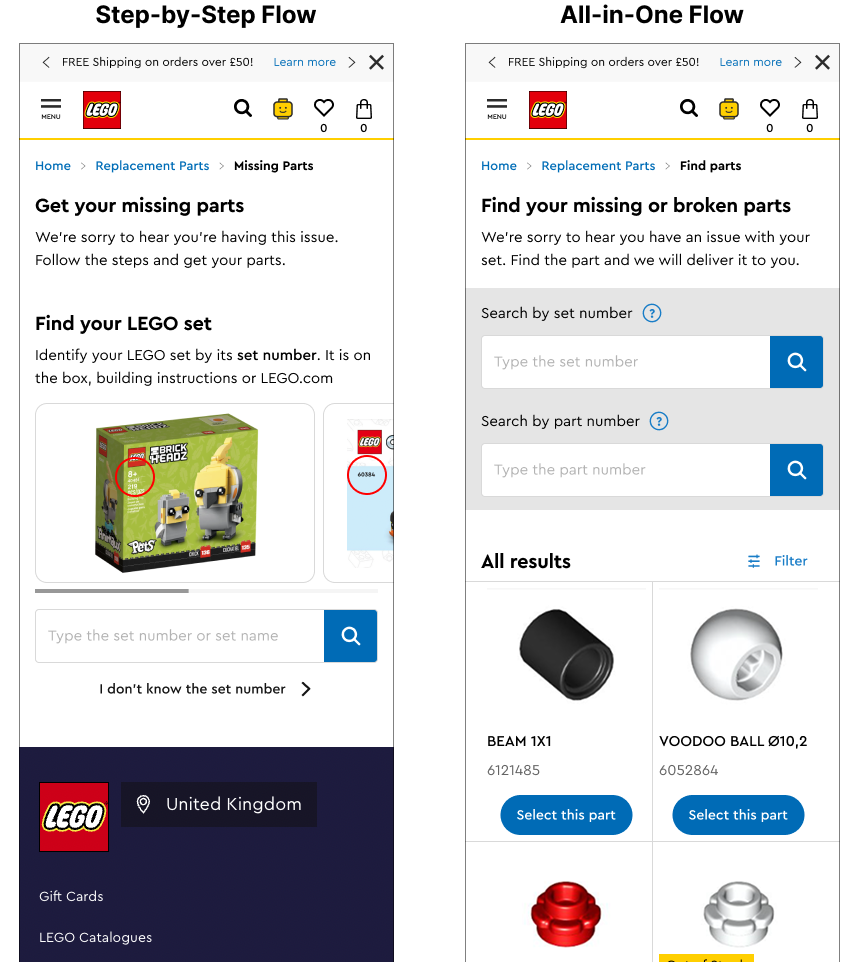
From day 4, I worked on building prototypes of the improved replacement parts flow. Hi-Fidelity prototypes were aimed to be created for a realistic experience when doing the user testing. Two prototypes were created based on some ideas from the day before - A step-by-step flow and an all-in-one flow.
Last Day: Test it
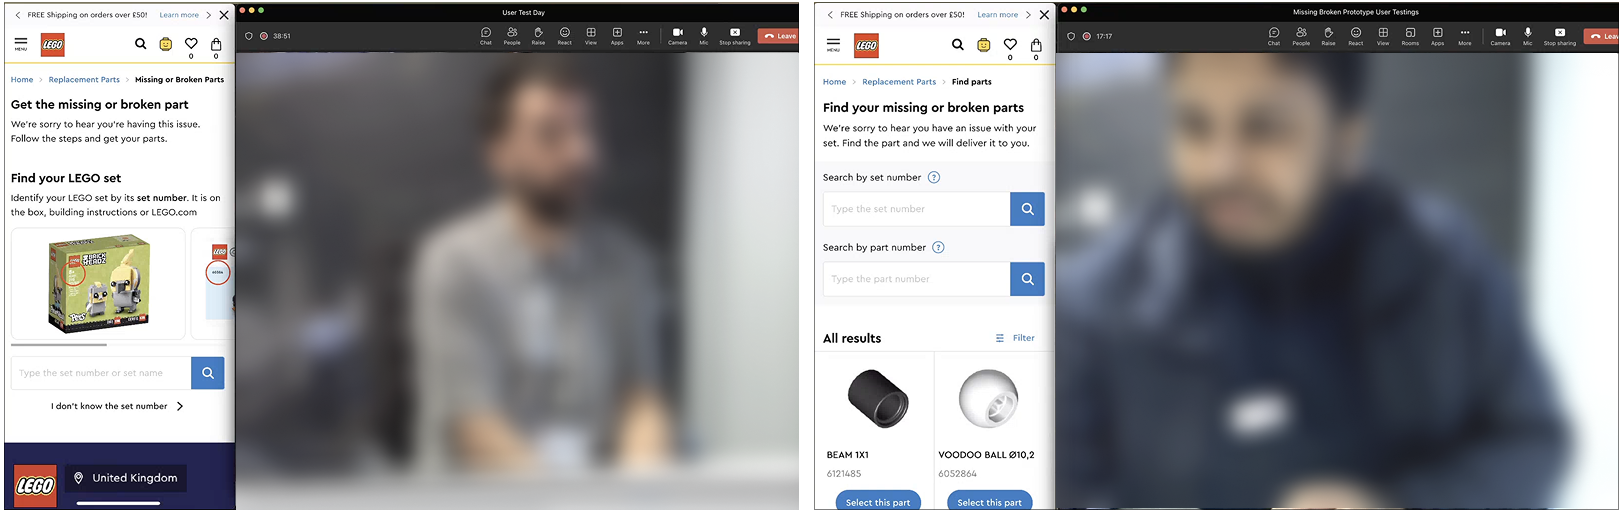
Two different flow prototypes were tested by recruited participants. The findings and insights from the testing helped us choose the right one, and prioritise the features that we need to develop.
Improved Product and Impacts
Development
The dev team worked on building the product. During this phase, lots of discussion happened to maximise the value versus the cost to build it. Based on some feasibility, some features and designs were iterated and eventually, the team launched the final products and it's live on all markets. And the iterations keep happening based on further findings and backlogs.
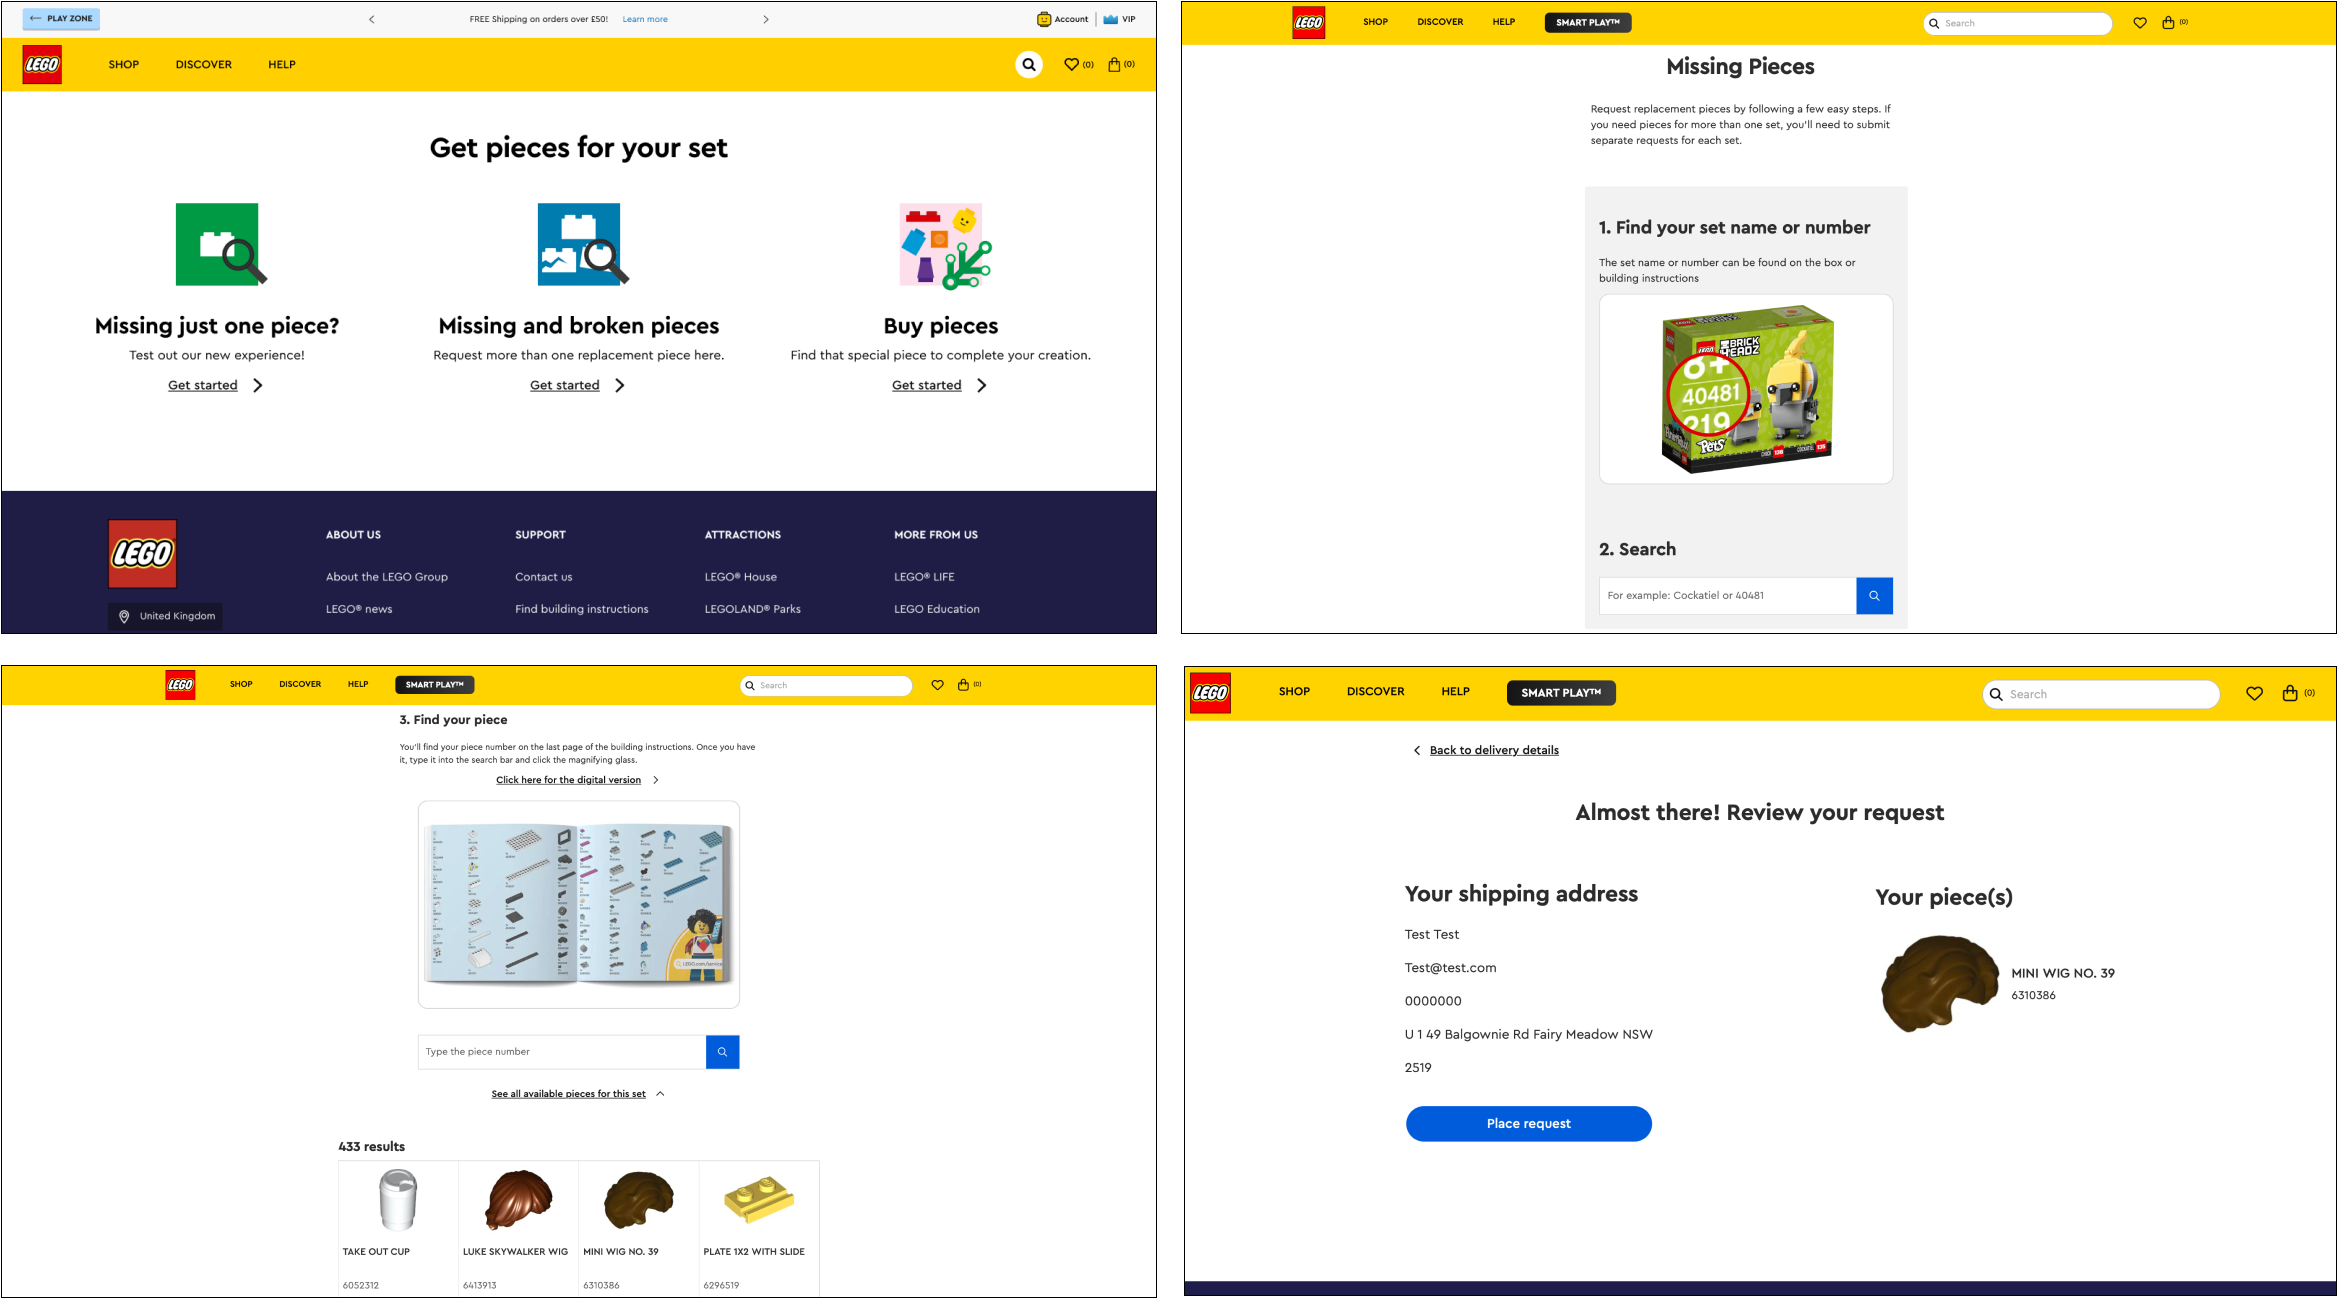
Improved Product
Post-Launch Usability Testing
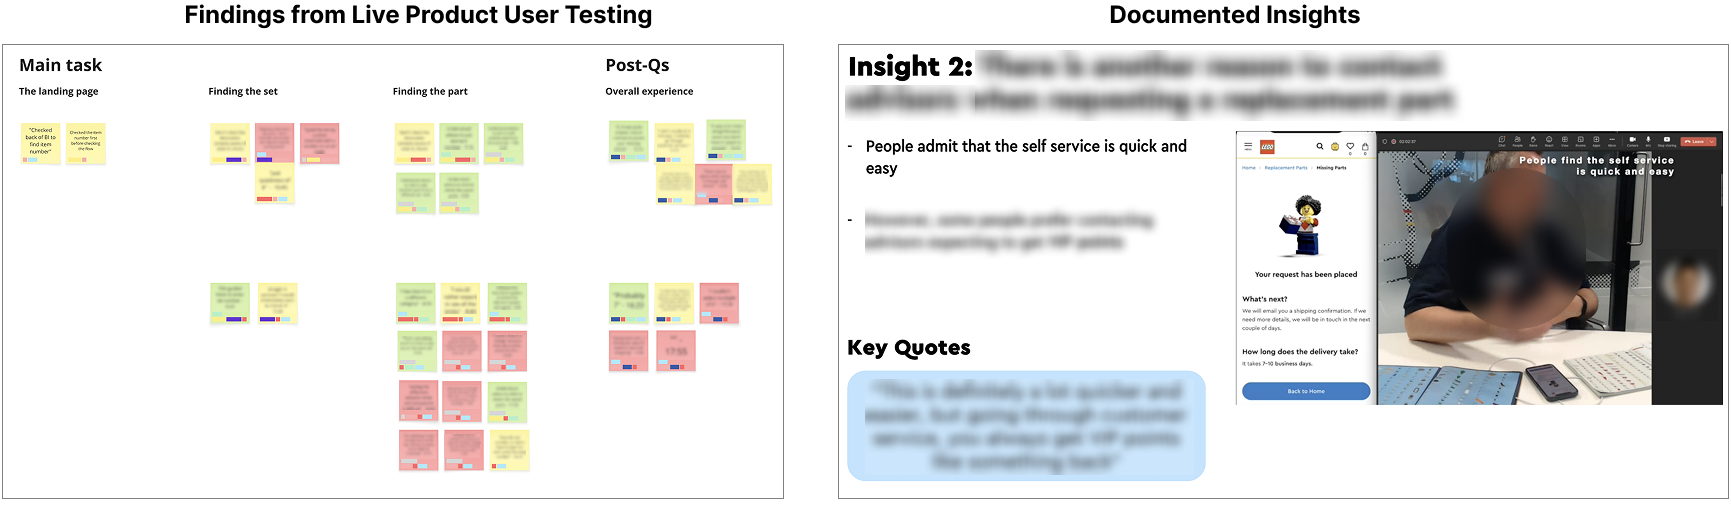
Live Product Usability TestingUsability testings were carried out with the live products. Findings and insights from the testing were documented and shared with the stakeholders, and in a product showcase meeting.
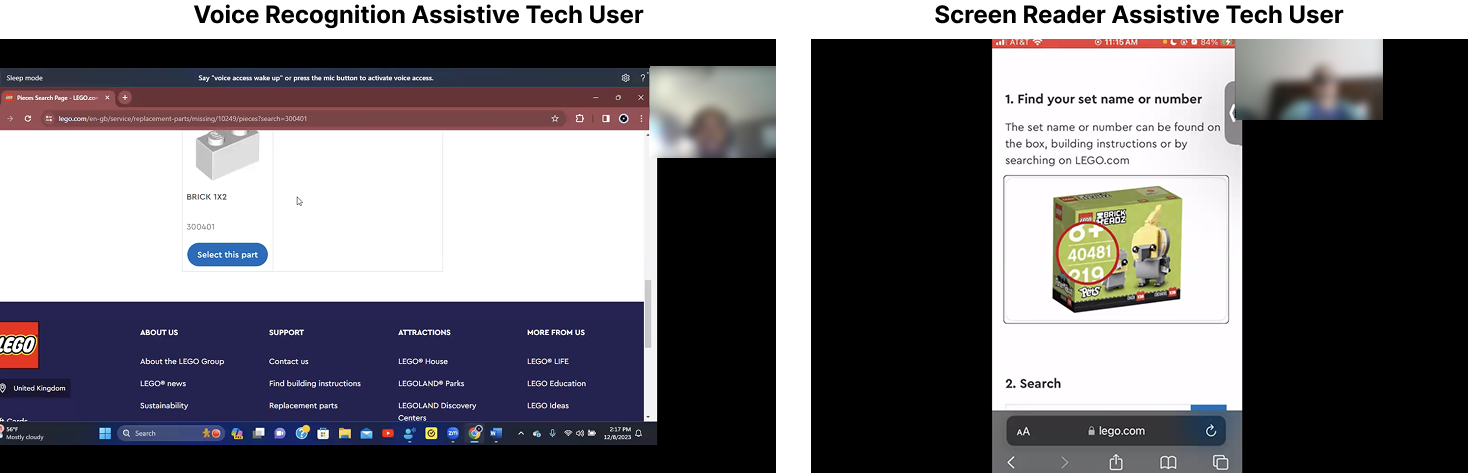
Accessibility TestingAccessibility of the flow was considered during the design and development phase. And accessibility-focused testing was conducted after the product went live. Total 4 participants who use assistive technology were recruited for this testing - 1 mobile screen reader user, 1 desktop screen reader user, 1 mobile screen magnification user and one desktop vocie recognition users. The findings and insights were documented and shared with the team and stakeholders, and the team continuously iterate, improve accessibliity of the flow.
Impacts
- The flow completion rate has increased, from less than 30% to approximately 60%.
- The contact to advisors about the related case (missing or broken brick requests) has decreased more than 5% than before.
- The number of fraud detection case has increased since we've added an advisors' intervention step when certain behaviour occurs during the flow.
Reflection
Both user experience and business goals are important.After the improvement, the completion rate has increased and the related case contact to advisors has gone down. Which means that not only now it delivers a better experience to users but also a great value to the business since there are less people contacting customer advisors. As a UX designer, representing users' needs and satisfaction is crucial but considering the business side is also important to make better products.
Prioritisation is important in a product develeopment.It'd be good if a product team can develop the products as what we want. However, due to the limited time and resources, prioritising features and flows when developing a product is needed. With a thorough discussion and planning, the most valualbe features can be developed first and improve more from the minimum viable product.